Early in my carrer, I joined a company with a highly mature TPM (Total Productive Maintenance) implementation. They were advancing their TPM journey with the help of an outstanding consultant
This consulting firm provided exceptionally comprehensive, step-by-step guidance. Even today, I consider them the best and most thorough consultant I’ve encountered. Every pillar had specific sub-steps, and more importantly, detailed scoring for each. Initially, I was a bit overwhelmed by the sheer amount of detailed guidance. Some of my colleagues simply followed the steps blindly, without even asking about the background or purpose of each step.
(Note: For those unfamiliar with TPM pillars or how they work, please check out my previous article: Various Pillars in TPM/IWS – Irvan Pasaribu
Let me give you an example. In the Q (Quality) pillar, they treat Step 0 as a prerequisite—a guide on what to prepare before starting the pillar. It ensures that a clear vision is established. The sub-steps guide you in setting up the pillar organization, meeting structures, ownership of KPIs and losses, training matrices, master plans, and more.
Not only do they provide the sub-steps, but they also guide you on how to achieve maturity in them. For instance, regarding KPI ownership: if we are mature enough, the KPIs are directly linked to our daily meeting structures. This ensures that any deviation triggers an immediate action plan to eradicate losses in a very short interval (daily), rather than realizing the problem when it is already too late.
Step 1: Cascading Vision to Measurement
In Step 1 of the Q pillar, the focus shifts to setting priorities. Specifically for Quality, it guides us on how to prioritize based on customer complaints. If we lack data, it mandates us to establish a data collection strategy. This exact same deployment and data collection setup must also be applied to rejects, downgrades (remixes), and other priority areas.
To put it simply, Step 1 is always about cascading the pillar’s vision into KPIs. We must ensure these KPIs align closely with business priorities. Actually, this principle applies to other pillars as well, such as PM (Planned Maintenance) and Safety. In whatever form an Operational Excellence program takes, there is a golden rule we must hold onto: If we cannot measure it, we cannot improve it. Step 1 ensures we connect our vision with the right measurement tools.
A very powerful philosophy in TPM is this: the more specifically you can link every program, direction, or loss to a critical machine area or process, the closer you are to eradicating that loss.
This is why, since Step 1, we are introduced to the QA Matrix (or PdM – Product Defect Matrix in IWS terminology). It is a table that links a list of quality problems directly to the critical processes that most likely cause them. The Quality pillar must build this database and perfect it over time. This is a highly specific tool unique to the PQ pillar; you won’t find it in the PM pillar, for example.
Step 2: Restoring Basic Conditions (RBC)
If you have read my previous articles, you know that TPM logic places “Restoring Basic Conditions” (RBC) as the essential baseline before any improvement can happen. (Please read those articles if you want a deeper understanding of this mindset: RESTORE BASIC CONDITIONS – Irvan Pasaribu ).
Every Step 2 in the pillar journey, including Q pillar, is about restoring basic conditions. Whenever you face an issue, the TPM approach is always to restore basic conditions in the critical areas associated with that specific issue first. Based on the QA Matrix, whenever the plant faces typical defect modes, the team has a clear guide on where to go (Gemba) and restore basic conditions as their very first line of attack.
Let me give you an example from the wood industry. Suppose we want to eradicate a quality defect on a finger joint product, such as broken joints. One of the critical areas is the finger joint feeder. The IPS (Initial Problem Solving) logic will guide us with these questions:
- When you do a Gemba walk to the feeder, do you find any abnormality tags? (In IWS, they call tagging “Defect Handling”). If so, resolve those tags first.
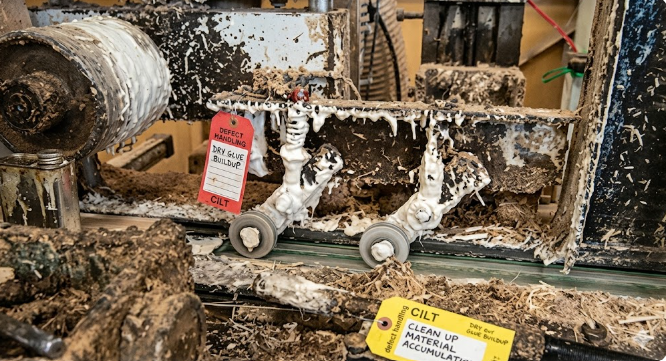
If you find poor conditions like in the picture above, TPM simply suggests: do a TCO (Total Clean Out), find more tags (defect handling in IWS), and solve them. If a CILT (Cleaning, Inspection, Lubrication, Tightening) standard exists, check if the operator is actually executing it. It’s that simple. Do the operators actually tag abnormalities when they see them?
IPS also prompts us to check the maintenance plan. For instance, if a Time-Based Maintenance (TBM) standard mandates a bearing change every 6,000 hours, we must check the records. Has it exceeded 6,000 hours? If yes, why was it skipped? Change the bearings immediately as per the standard.
The PQ Pillar Twist: Detection vs. Eradication
There is one highly interesting fact about Q Pillar Step 2: when discussing RBC, it doesn’t immediately focus on the machine or eradicating the defect at the source. Instead, it focuses heavily on the Failure of the Detection System.
Whenever there is a customer claim or complaint, the very first question the Quality pillar should ask is not about critical machine areas or operator mistakes. Instead, they must ask: Why was this defect not caught by our existing detection system?
The discussion should start here: What is our current detection system? Is it the correct method? Can it catch all defects before they are shipped to the customer?
For example, a wood manufacturer reviewed 5 years of claims and found their biggest financial loss came from broken coatings. A typical strong AM (Autonomous Maintenance) organization would immediately jump to the Gesso machines: Are the parameters right? Is maintenance okay? Are there serious tags (defect handling) affecting coating strength? If they are advanced, they might even check the M6 Head machine or the coating mixer’s RPM.
However, they often forget to ask the most crucial question: How did the broken coating pass our QC checks in the first place? Are our QC methods actually capable of detecting this defect? How many inspection blockades do we have in the process?
All of this logic is explained in the following logic step:
Claim:
Defect is detected in internal organization?
- Detected but not stopped?
- Not detected?
- We do not control the defect at all
Then we can go to Defect Eradication
Understanding the logic presented in this table—and spreading it throughout the plant organization—has a massive impact.
A Real-Life Case Study
A few years ago, I consulted for an industry market leader company who is implementing TPM. Their AM implementation was excellent; the organization was highly responsive to machine abnormalities, and defect handling was deeply embedded in their shopfloor culture. I could easily pick from many capable employees to run improvement teams.
However, when analyzing customer complaints, I noticed several massive, recurring claims. It was unusual for an organization with such strong problem-solving capabilities to be so helpless against complaints that were actively damaging their reputation.
During a workshop with the Quality pillar, I realized they lacked an understanding of the true Q pillar philosophy. Their approach to handling claims was always to jump straight into eradicating the source of the defect at the machine. It is not wrong, but focusing solely on that can be highly ineffective.
The defect in question was holes in their product. For years, they had been trying to fix critical machine areas associated with this defect. For example, they increased the cleaning frequency of the one part of extruders to ensure trapped gases were released.
From a Quality pillar perspective, the first question should have been: “Why couldn’t our existing quality system detect the products with holes? Is our AQL (Acceptable Quality Limit) sufficient to prevent them from passing to customers?” No one had ever asked this.
Using Kepner-Tregoe’s Is vs. Is Not logic, I asked, “When did this complaint become massive?” “I remember it started around (they mention a year),” someone said. “What happened right before that? What changed?” I pressed.
Triggered by this, the senior quality manager realized: “Before (the year), we had two crews manually bundling the product. While bundling, they performed a 100% visual check and separated defective products, in addition to the hourly AQL checks.”
“What is different now?” I asked. “We installed an automatic bundling machine that replaced those two crews. Now, we only rely on the hourly QC inspection,” the manager explained. “And clearly, that inspection is not enough to catch defects passing between checks,” another participant concluded.
Once this mindset was injected into the pillar members, the direction of their brainstorming entirely changed. They stopped trying to instantly fix the machine and started discussing how to restore a 100% detection system.
Returning to manual bundling was impossible due to the automation investment. So, cross-pillar collaboration kicked in. A warehouse manager suggested, “My outbound team, who loads the trucks, can be trained to spot and separate these defects before shipping.” A QC supervisor added, “I’ll have my team collect those separated defects daily to build our defect mode data.”
They applied the action plan immediately. While not a perfect 100% detection, the warehouse team’s capability significantly reduced the claims.
To achieve true 100% detection again, they investigated further. An engineer—acting as both SME and pillar member—noticed that whenever the machine produced holes, a pressure indicator on a downstream machine would dip. “Why don’t we change that manual pressure gauge to a digital one?” he suggested. “When the pressure dips, it will trigger a flashing alarm.”
With this new alarm acting as a detection system, operators could immediately separate defective products. The company reduced their product-hole claims to zero. Yes, they still had to eradicate the root cause at the machine, but they had safely restored the company’s reputation first.
Applying the Logic in Non-TPM Organizations
This PQ pillar logic applies perfectly even in non-TPM organizations. I once consulted for a highly capable wood processing company facing millions of dollars in claims. Their main defect was a broken coating film on their products.
Using the Step 1 logic, I had them analyze the claims. Around 70% of the broken films were caused by the coating being thicker than specified. My next question was: “How is it possible that our QC system passes coatings that are too thick?”
Our existing detection system was an hourly dimensional check of the final product’s length and width. This system incorrectly assumed that the raw wood underneath the coating had zero dimensional variation.
Through deeper observation, we found that the raw wood dimensions did vary. When the coating was too thick, it was usually because the wood underneath was too thin, keeping the final product within the acceptable total dimension limits. We had to completely change our detection method to measure the coating film thickness directly, rather than the overall product dimension.
Why Put SPC in the “Restore Basic Conditions” Phase?
I was raised with a TPM mindset, which highly prioritizes Restoring Basic Conditions before jumping into advanced improvements. Early in my career, I was assigned an SPC (Statistical Process Control) project. At the time, SPC felt incredibly complex, full of mathematical calculations like Cp, Cpk, and control limits.
Because of its sophisticated nature, I never imagined SPC would be launched as early as Quality Pillar Step 2. All of Step 2 is supposed to be about restoring basic conditions (like restoring QC systems or measurement reliability). So why put SPC here?
Let’s look at how SPC actually works. The initial activity is creating “Operating Control Limits” to monitor outliers. To get these, we calculate “Initial Control Limits” using historical data. We plot the data and remove the outliers based on SPC rules.
However, many people simply remove the outlier data mathematically without investigating why that data became an outlier in the first place. This leads to operational chaos later.
In my experience, almost every root cause for these initial outliers boils down to a lack of basic conditions. That is the reason some companies place SPC in Step 2. They aren’t trying to force a sophisticated program into a basic phase; rather, they use SPC—applied to highly critical characteristics—to act as a guide for Restoring Basic Conditions.
Returning to the wood coating example: after we fixed our detection method, we still needed to stop producing internal rejects. Because wood dimension variation was the root cause, and it was a critical parameter, we applied SPC.
When we analyzed the outliers to get our control limits, we traced the defect origin upstream to the M6H machine. Unsurprisingly, the root causes of the variation were entirely related to degraded basic conditions: deteriorated parts, worn knives, and incorrect settings due to a lack of competence.
By restoring all of them, we didn’t just calculate our operating control limits; we successfully restored the basic conditions of our most critical product characteristics.
Example of other Activities in Quality Pillar Step 2: R&R
Some organizations emphasize the reliability of their measurement systems. They ensure inspector capabilities are uniform and that measurement devices are accurate.
They measure this reliability using R&R (Repeatability and Reproducibility). The principle is simple: compare data by having two different inspectors measure the same object with the same device, or having one inspector measure the same object multiple times. This data is statistically analyzed (using Minitab or we can set up in Excel).
If the R&R score is below 10%, the system is reliable. Between 10% and 30% is acceptable. If the score is over 30%, the measurement system is unreliable. We cannot improve a process if we do not trust what we are measuring. We must fix our measurement system first.
The Learning
In the end, implementing Step 2 of the Q pillar is as much about leadership as it is about engineering. When leaders bring the correct philosophy to the shop floor and gain the team’s buy-in, magic happens. The operators, engineers, and QC staff already possess years of valuable experience; they just need the right framework to apply it. By shifting their focus to the failure of the detection system and the restoration of basic conditions, you unlock their ability to solve issues that have plagued the company for years. Master the basics, guide your team’s mindset, and the complex improvements will naturally follow.